Global Life Expectancy Analysis
- Gina Chee
- Jul 16, 2024
- 8 min read

Updated: Jun 22, 2025
The goal of this project is to explore global life expectancy trends by performing data cleaning and conducting exploratory data analysis. Cleaning our data ensures accuracy and reliability, and through exploratory analysis, we uncover patterns, correlations, and insights related to life expectancy across different countries.
Process
In this project, we will utilize MySQL to perform both data cleaning and exploratory data analysis. The process will involve several key steps:
Data Cleaning
Import data
Handle missing values
Remove duplicates
Handle inconsistencies
Exploratory Data Analysis
Correlation Analysis: Assess relationships between life expectancy and other variables, such as GDP, Country Status, and BMI.
Grouping and Aggregation: Group data by relevant categories (e.g., country, year) to analyze trends and compare groups.
Highlights
Not all metrics available in the dataset show a strong correlation. Key highlights from the analysis:
Correlation between Life and Expectancy and GDP
Countries with higher GDP tend to have higher life expectancy, while those with lower GDP generally have lower life expectancy.
Correlation between Life Expectancy and Country Status
Developed countries typically have higher average life expectancy compared to developing countries. However, the larger number of developing countries skews the overall average, making country status an unreliable metric for gauging life expectancy.
Life Expectancy Trends Overtime
There is a positive trend in life expectancy over the years, with an average increase of 7.3% over the past 15 years.
These highlights emphasize the need for a careful approach when analyzing the factors affecting life expectancy, as not all available metrics provide clear or strong correlations.
Data Import and Data Cleaning
Data Import
We first created a schema before importing our JSON file into MySQL using the “Table Data Import Wizard” function. Prior to this, the JSON file was examined and confirmed that it is a relatively small dataset with 2,421 rows to be imported.

Data Integrity Checklist
The checklist provides essential initial checks for my data cleaning process. The items below are not exhaustive:
Identify Missing Values: Check for missing values across relevant columns.
Handle Duplicates: Identify and handle any duplicate rows using appropriate methods.
Address Inconsistencies: Identify and resolve inconsistencies in data entries.
Validate Data Types: Ensure data types are appropriate for analysis and processing.
Verify Data Integrity: Validate data against known standards or constraints.
Data Understanding and Data Cleaning
Before starting data cleaning, we first review the entire data to identify any inconsistencies.
Upon generating the data, some consistencies were spotted, such as missing values in both ‘Status’ column and the ‘Life expectancy’ column.
Looking at the entire data as a whole
-- Look at all the data
SELECT *
FROM World_Life_Expectancy;
Handle Duplicates
Before addressing these blanks, we first checked for duplicate values by examining the two main columns: Country and Year. We found that Ireland, Senegal, and Zimbabwe have duplicate rows in the data.
-- Check for Duplicates
SELECT
	Country,
	Year,
  CONCAT(Country, Year),
  COUNT(CONCAT(Country, Year))
FROM World_Life_Expectancy
GROUP BY Country, Year, CONCAT(Country, Year)
HAVING COUNT(CONCAT(Country,Year)) > 1; 
The Row_ID is necessary to ensure we remove the correct duplicate rows. We first performed a query to identify the duplicates before executing the deletion using DELETE FROM along with a subquery that uses ROW_NUMBER() and PARTITION BY functions.
-- Extract Row_ID from duplicate rows in order to delete the correct rows using subquery and row_number() and partition by function
SELECT *
FROM (
	SELECT
		Row_ID,
		CONCAT(Country, Year),
		ROW_NUMBER() OVER (PARTITION BY CONCAT(Country, Year) ORDER BY CONCAT(Country, Year)) AS Row_Num
	FROM World_Life_Expectancy) AS Row_Table
WHERE Row_Num > 1;

-- Delete duplicate rows
DELETE FROM World_Life_Expectancy
WHERE
	Row_ID IN (
	SELECT Row_ID
FROM (
	SELECT
		Row_ID,
		CONCAT(Country,Year),
		ROW_NUMBER() OVER (PARTITION BY CONCAT(Country, Year) ORDER BY CONCAT(Country,Year)) AS Row_Num
	FROM World_Life_Expectancy
    ) AS Row_Table
WHERE Row_Num > 1
);
Handle Blank Values
Earlier, we identified inconsistencies in both the ‘Status’ and ‘Life expectancy’ columns. The following code will dive into these blank fields in more detail. In the ‘Status’ column, it can be seen that there are 8 rows with blank values, and none with null values.
-- Identify blank values in 'Status' column
SELECT *
FROM World_Life_Expectancy
WHERE Status = '';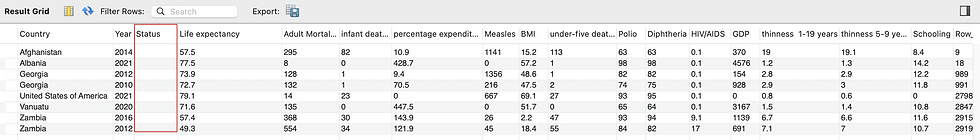
-- Identify NULL values in 'Status' column
SELECT *
FROM World_Life_Expectancy
WHERE Status IS NULL;
In ‘Status’ column, it is observed that there are only two unique values: ‘Developing’ and ‘Developed’.
-- Check unique values in Status column.
SELECT DISTINCT(Status)
FROM World_Life_Expectancy
WHERE Status <> '';
Blank fields in the 'Status' column were filled by performing a self-join and matching the fields with other rows within the same table.
-- Check unique values in Country column with the status 'Developing'
SELECT DISTINCT(Country)
FROM World_Life_Expectancy
WHERE Status = 'Developing';

-- Filling blank status with developing if it matches with the rows of the same Country
UPDATE World_Life_Expectancy t1
JOIN World_Life_Expectancy t2
	ON t1.Country = t2.Country
SET t1.Status = 'Developing'
WHERE t1.Status = ''
AND t2.Status <> ''
AND t2.Status = 'Developing';

UPDATE World_Life_Expectancy t1
JOIN World_Life_Expectancy t2
	ON t1.Country = t2.Country
SET t1.Status = 'Developed'
WHERE t1.Status = ''
AND t2.Status <> ''
AND t2.Status = 'Developed';
Self-check was carried out to ensure there are no more blank values in the ‘Status’ column.
-- Check the data
SELECT *
FROM World_Life_Expectancy
WHERE Status = '';
Earlier, blank fields were also identified in the ‘Life expectancy’ column. Two countries, Afghanistan and Albania, have missing values.
-- Blanks in Life expectancy column
SELECT *
FROM World_Life_Expectancy
WHERE `Life expectancy` = '';
The ‘Country’, ‘Year’, and ‘Life expectancy’ columns were extracted to address the missing values in the ‘Life expectancy’ column. With only two missing values identified, it was suggested to fill these values with the average of the life expectancies from the previous and following year of the year with the missing value. This approach is justified by the observed trend of increasing life expectancy over time, ensuring a safe and reasonable estimation.
-- Extract specific columns to identify ways to deal with missing values
SELECT
	Country,
	Year,
	`Life expectancy`
FROM World_Life_Expectancy; 
To ensure accurate calculation of the average life expectancy for the missing field, a double self-join was carried out. This involved extracting the life expectancy values from both the previous and subsequent years. The output included the original data with the missing value, along with the subsequent year’s data, the previous year’s data, and the calculated average life expectancy. This approach ensured that the correct data was used before integrating it into our main dataset.
-- Query to calculate the average life expectancy
SELECT
	t1.Country, t1.Year, t1.`Life expectancy`, -- Original data
	t2.Country, t2.Year, t2.`Life expectancy`, -- Reflect the following year's life expectancy
	t3.Country, t3.Year, t3.`Life expectancy`, -- Reflect the previous year's life expectancy
	ROUND((t2.`Life expectancy` + t3.`Life expectancy`)/2,1) -- Calculating the average life expectancy for blank fields
FROM World_Life_Expectancy t1 -- Original data
JOIN World_Life_Expectancy t2
	ON t1.Country = t2.Country
    AND t1.Year = t2.Year - 1 -- Following year's data
JOIN World_Life_Expectancy t3
	ON t1.Country = t3.Country
    AND t1.Year = t3.Year + 1 -- Previous year's data
WHERE t1.`Life expectancy` = ''; 
The blank fields were filled with calculated average life expectancy into the main dataset using UPDATE and self-join.
-- Filling up the blank fields in Life expectancy column with the average value
UPDATE World_Life_Expectancy t1
JOIN World_Life_Expectancy t2
	ON t1.Country = t2.Country
    AND t1.Year = t2.Year - 1
JOIN World_Life_Expectancy t3
	ON t1.Country = t3.Country
    AND t1.Year = t3.Year + 1
SET t1.`Life expectancy` = ROUND((t2.`Life expectancy` + t3.`Life expectancy`)/2,1)
WHERE t1.`Life expectancy` = ''; 
Exploratory Data Analysis (EDA)
Minimum and Maximum Life Expectancy for Respective Countries
While exploring the minimum and maximum life expectancy of each countries, there were some countries with 0 minimum and maximum life expectancy. This might highlight potential data quality issue which will be reviewed later on.
-- Minimum and Maximum Life Expectancy of the respective countries
-- Extracting 0 for Min and Max Life Expectancy
SELECT
	Country,
    MIN(`Life expectancy`) AS 'Min Life Expectancy',
    MAX(`Life expectancy`) AS 'Max Life Expectancy'
FROM World_Life_Expectancy
GROUP BY Country
HAVING MIN(`Life expectancy`) = 0
AND MAX(`Life expectancy`) = 0
ORDER BY Country DESC; 
The code snippet below explores the life expectancy of the respective countries, filtering out countries with 0 minimum and maximum life expectancy.
An amazing finding was that countries like Haiti, Zimbabwe, Eritrea, and Uganda increased their life expectancy by 20 years or more within a span of 15 years. In contrast, some countries showed smaller increases, which is understandable given their already high life expectancy like Fiji, Costa Rica, Qatar, and Mexico.
-- Minimum and Maximum Life Expectancy of the respective countries
-- Filter out data that does not have 0 for min and max life expectancy
SELECT
	Country,
    MIN(`Life expectancy`) AS Min_Life_Expectancy,
    MAX(`Life expectancy`) AS Max_Life_Expectancy,
    (ROUND(MAX(`Life expectancy`) - MIN(`Life expectancy`),1)) AS Life_Increase_15_Yrs
FROM World_Life_Expectancy
GROUP BY Country
HAVING MIN(`Life expectancy`) <> 0
AND MAX(`Life expectancy`) <> 0
ORDER BY Life_Increase_15_Yrs DESC;

Average Life Expectancy as a Whole
Overall, when examining the data by year rather than by country, the data shows a healthy trend of increasing life expectancy. In 15 years, the average life expectancy has increased by 7.3%.
-- Average Life Expectancy Yearly as a Whole
SELECT
	Year,
    ROUND(AVG(`Life expectancy`),2) AS Avg_Life_Expectancy
FROM World_Life_Expectancy
GROUP BY Year
ORDER BY Year; 
Correlation between Life Expectancy and GDP
The purpose of this query is to determine if higher life expectancy correlates with increased income generation for a country. As shown in the snippets below, countries with lower average life expectancy tend to have lower average GDP, while those with higher average life expectancy generally exhibit higher average GDP.
-- Correlation between Life Expectancy and GDP
-- Life Expectancy in Ascending Order
SELECT
	Country,
    ROUND(AVG(`Life expectancy`),1) AS Avg_Life_Expectancy,
    ROUND(AVG(GDP),1) AS Avg_GDP
FROM World_Life_Expectancy
GROUP BY Country
HAVING Avg_Life_Expectancy > 0
AND Avg_GDP > 0
ORDER BY Avg_Life_Expectancy ASC;

-- Life Expectancy in Descending Order
SELECT
	Country,
    ROUND(AVG(`Life expectancy`),1) AS Avg_Life_Expectancy,
    ROUND(AVG(GDP),1) AS Avg_GDP
FROM World_Life_Expectancy
GROUP BY Country
HAVING Avg_Life_Expectancy > 0
AND Avg_GDP > 0
ORDER BY Avg_Life_Expectancy DESC; 

To summarize the correlation between Life Expectancy and a Country’s GDP, we divided the data into two groups: countries with a GDP of 1.5 million or above, and countries with a GDP below 1.5 million. The analysis shows that countries with higher GDP tend to have higher life expectancy, while those with lower GDP tend to have lower life expectancy.
SELECT
SUM(CASE WHEN GDP >= 1500 THEN 1 ELSE 0 END) High_GDP_Count,
AVG(CASE WHEN GDP >= 1500 THEN `Life expectancy` ELSE NULL END) High_GDP_Life_Expectancy,
SUM(CASE WHEN GDP < 1500 THEN 1 ELSE 0 END) Low_GDP_Count,
AVG(CASE WHEN GDP < 1500 THEN `Life expectancy` ELSE NULL END) Low_GDP_Life_Expectancy
FROM World_Life_Expectancy; 
Correlation between Country Status and Life Expectancy
The countries are categorized as either developed or developing. While developed countries generally have a higher average life expectancy, there are only 32 developed countries compared to 161 developing countries. This disparity skews the results, as the larger number of developing countries lowers the overall average. Therefore, using a country’s status as a metric to gauge life expectancy is not very effective.
-- Correlation between Life Expectancy and Countries's Status
SELECT
	Status,
    COUNT(DISTINCT(Country)) AS Countries,
    ROUND(AVG(`Life expectancy`),1) AS Avg_Life_Expectancy
FROM World_Life_Expectancy
GROUP BY Status;
Reflection
It is crucial to back up our data before making any changes. This ensures that if we make any errors during data manipulation, we can easily restore the original dataset. Having a backup provides a safety net, allowing us to experiment and make corrections without the risk of losing valuable data.
While it may appear that data cleaning and exploratory data analysis (EDA) are separate tasks, they are often performed simultaneously. This concurrent approach enables us to iteratively refine our dataset while gaining insights into its structure and relationships. By addressing missing values, duplicates, and inconsistencies during data cleaning, we can immediately visualize and analyze the data to identify trends, patterns, and outliers. This integrated process enhances our understanding of the data and ensures that our analysis is based on accurate and reliable information.