Performance and Revenue Insights for Podiatry Clinics
- Gina Chee
- Aug 24, 2024
- 17 min read

Updated: Jun 22, 2025
This project focus on developing a dashboard for a healthcare's company management team, enabling them to effectively monitor key business metrics. The primary stakeholders include the CEO, COO/Head of Operations, and Head of Marketing. The dashboard is designed to be a valuable tool during their bi-weekly stakeholders' meetings, offering tailored insights for management.
The provided datasets focus solely on January 2022, which may not accurately represent the overall performance.
Dashboard Objectives:
Provide key metrics essential to the business's performance.
Create a user-friendly dashboard that stakeholders can easily navigate.
Project Environment
The datasets were provided as CSV files. For this project, MySQL was used for data understanding, cleaning, and exploratory data analysis (EDA), which the dashboard was created using Tableau.
MySQL was selected for easy management and manipulation of data, especially for structured data. Tableau was chosen to easily visualize data, and dashboard creation.
Data Sources and Definition
Data Sources
This project utilizes two primary data sources:
Patients Dataset: This dataset includes demographic information about patients, specifically Patient ID, Gender, and Date of Birth.
Transactions Dataset: This dataset captures detailed consultation records, including Consult ID, Doctor ID, Clinic Location, Patient ID, Appointment Date and Time, Appointment Type, Appointment Length, Price, Reason for Visit, Payment Mode, and Visit Status.
Data Definition
The two primary data sources were initially provided in CSV format with general data type. After importing them into MySQL, the data types were automatically detected and assigned to MySQL, based on the content of each column.
Patients Dataset
Column Name | Data Type | Description |
Patient ID | String | Patient Identifier. |
Gender | String | Patient's Gender. 1. F represents Female 2. M represents Male |
Birthday | String | Patient's Date of Birth |
Transactions Dataset
Column Name | Data Type | Description |
Consult ID | Integer | Consult Unique Identifier |
Doctor ID | Integer | Doctor Unique Identifier |
Clinic Location | String | The region the clinic is located at. The values are: 1. North 2. South 3. West 4. North East 5. East |
Patient ID | Integer | Patient Unique Identifier |
Appointment Date Time | String | The date and time of when the consultation happen. |
Appointment Type | String | The type of appointment. The values are: 1. New Patient 2. Follow-up Visit 3. Procedure |
Appointment Length | Integer | The duration of the appointment in minutes. The values are: 1. 15 2. 30 3. 60 |
Price | Integer | The price of the consultation. |
Reason for Visit | String | Stating the reason for visit. This can also be treated as diagnosis. |
Payment Mode | String | The selected mode of payment for the consultation. The values are: 1. Cash 2. Insurance 3. Credit Card |
Visit Status | String | The status of the consultation. The values are: 1. No-Show 2. Completed 3. Rescheduled 4. Cancelled |
Data Understanding
Before beginning data cleaning or exploratory data analysis (EDA), it is crucial to first understand the given datasets. This preliminary step is essential for identifying and addressing any inconsistencies within the data.
Data Volume
In the patients dataset, there are 1,643 records, while the transactions dataset only has 1,645 records, with a difference of two records.
//Data Size for patients dataset
SELECT COUNT(*) AS patients_data_count
FROM patients;

//Data Size for transactions dataset
SELECT COUNT(*) AS transactions_data_count
FROM transactions

Missing Values
Patients Dataset
During the data import process, MySQL automatically assigns data types based on the detected values. However, it is important to manually change the Patient ID column in the patients dataset to a text type. Failing to do so led to missing records, as records with missing Patient ID values were not imported. Without this adjustment, 1,508 records were imported instead of 1,643, resulting in a discrepancy of 135 records. Upon review, 135 records were found without Patient ID. Besides Patient ID, the other columns - Gender and Birthday do not have any missing values.
-- Check for blank values in Patient ID column in patients dataset
SELECT *
FROM patients
WHERE `Patient ID` = '';

-- Check for blank values in Gender column in patients dataset
SELECT *
FROM patients
WHERE Gender = '';

-- Check for blank values in Birthday column in patients dataset
SELECT *
FROM patients
WHERE Birthday = '';

Transactions Dataset
The transactions dataset is in good condition, with no blank or null values present in the table.
-- Check for blank/null values in transactions dataset
SELECT *
FROM transactions
WHERE COALESCE(
    NULLIF(`Patient ID`, ''),
    `Doctor ID`,
    NULLIF(`Clinic Location`, ''),
    NULLIF(`Appointment Date Time`, ''),
    NULLIF(`Appointment Type`, ''),
    `Appointment Length`,
    Price,
    NULLIF(`Reason For Visit`, ''),
    NULLIF(`Payment Mode`, ''),
    NULLIF(`Visit Status`, '')
) IS NULL;
Duplicate Data Records
Both datasets are relatively clean with no duplicate records. This indicates that the data is consistent, reducing the need for extensive cleaning processes.
-- Check for duplicate records in patient dataset
SELECT
	`Patient ID`,
   Gender,
   Birthday,
   COUNT(*) AS RowCount
FROM patients
GROUP BY
	`Patient ID`,
   Gender,
   Birthday
HAVING COUNT(*) > 1;

-- Check for duplicate records in transactions dataset
SELECT
    `Consult ID`,
    `Doctor ID`,
    `Patient ID`,
    `Appointment Date Time`,
    `Appointment Type`,
    `Appointment Length`,
    Price,
    `Reason For Visit`,
    `Payment Mode`,
    `Visit Status`,
    COUNT(*) AS RowCount
FROM transactions
GROUP BY
    `Consult ID`,
    `Doctor ID`,
    `Patient ID`,
    `Appointment Date Time`,
    `Appointment Type`,
    `Appointment Length`,
    Price,
    `Reason For Visit`,
    `Payment Mode`,
    `Visit Status`
HAVING COUNT(*) > 1; 

Unique Values
Checks on the unique values in both datasets were performed using the DISTINCT function. This verification ensured data consistency and accurately reflected the available range of options, which is essential for reliable analysis and decision-making.
-- Unique values in Gender column in patients dataset
SELECT DISTINCT(Gender)
FROM patients;

-- Unique values in Doctor ID column in transactions dataset
SELECT DISTINCT(`Doctor ID`)
FROM transactions;

-- Unique values in Appointment Type column in transactions dataset
SELECT DISTINCT(`Appointment Type`)
FROM transactions;

-- Unique values in Appointment Length column in transactions dataset
SELECT DISTINCT(`Appointment Length`)
FROM transactions;

-- Unique values in Clinic Location column in transactions dataset
SELECT DISTINCT(`Clinic Location`)
FROM transactions;

-- Unique values in Price column in transactions dataset
SELECT DISTINCT(Price)
FROM transactions;

-- Unique values in Reason for Visit column in transactions dataset
SELECT DISTINCT(`Reason For Visit`)
FROM transactions;

-- Unique values in Payment Mode column in transactions dataset
SELECT DISTINCT(`Payment Mode`)
FROM transactions;

-- Unique values in Visit Status column in transactions dataset
SELECT DISTINCT(`Visit Status`)
FROM transactions;
Additionally, we performed checks on the unique values in the newly created Appointment Date and Appointment Time columns. These columns were introduced during the data manipulation stage.
-- Unique values in Appointment Date column in transactions dataset
SELECT DISTINCT(`Appointment Date`)
FROM transactions;

-- Unique values in Appointment Time column in transactions dataset
SELECT DISTINCT(`Appointment Time`)
FROM transactions;
Overall, the datasets are free from inconsistencies, with distinct values observed across the datasets.
Results from the unique value check:


Data Cleaning & Manipulation
Data Cleaning and Manipulation often occur alongside data exploration or understanding during EDA phase. In this project, I am utilizing MySQL to perform these data manipulation tasks.
Modify BIRTHDAY column to DATE Data Type
The Birthday column in the patients dataset was originally in text format. In the code below, the column will be converted from text to a date format, allowing us to more effectively analyze the customer demographics.
To accomplish this, a new column named New_Birthday with a date data type and populate it with values from the original Birthday column. Afterward, the old Birthday column will be drop and rename New_Birthday to Birthday.
-- Test: Create new birthday column and set the column to date data type
-- Note: Not amending the existing table yet
SELECT
	Birthday,
    STR_TO_DATE(Birthday, '%M %d, %Y') AS New_Birthday
FROM patients;

-- Add a new birthday column and set data type as date in patients dataset
ALTER TABLE patients
ADD COLUMN New_Birthday DATE;

-- Insert birthday values into the new column - New_Birthday in patients dataset
UPDATE patients
SET New_Birthday = STR_TO_DATE(Birthday, '%M %d, %Y');

-- Drop old column - Birthday in patients dataset
ALTER TABLE patients
DROP COLUMN Birthday;

-- Rename new column name from New_Birthday to Birthday in patients dataset
ALTER TABLE patients
RENAME COLUMN New_Birthday TO Birthday;

-- View the patients dataset
SELECT *
FROM patients;
Modify Patient ID column to INT Data Type
This adjustment was made to facilitate easier matching of Patient ID with those in the transactions table during EDA. By standardizing the data types, we ensure smoother data integration and more accurate analysis when linking patient information across datasets.
-- Adding a new Patient ID Column
ALTER TABLE patients
ADD COLUMN New_Patient_ID INT;

-- Insert values into New_Patient_ID column and update the existing table
UPDATE patients
SET New_Patient_ID = CASE
    WHEN `Patient ID` = ''  THEN NULL  -- Keep blank values as nulls
    ELSE CAST(`Patient ID` AS UNSIGNED)
END;

-- Re-order the new column and move it to the first column before dropping the old Patient ID column
ALTER TABLE patients
MODIFY COLUMN New_Patient_ID INT FIRST;

-- Drop the old Patient ID column
ALTER TABLE patients
DROP COLUMN `Patient ID`;

-- Rename the New_Patient_ID column to Patient ID to align with transactions dataset
ALTER TABLE patients
RENAME COLUMN New_Patient_ID TO `Patient ID`;

-- View the Patients Dataset
SELECT *
FROM patients;
Modify Appointment Date Time column to Individual Columns
A Day column was introduced to the transactions dataset to facilitate easier visualization during the EDA phase. This addition allows us to analyze and identify trends in the patient visits by day of the week, which will help us to determine later which days are most popular.
To create this column, DAYNAME function was applied to the Appointment Date field, extracting the specific day of the week for each transaction. This could potentially uncover patterns in appointment scheduling and may allow us to optimize resource allocation accordingly.A Day column was introduced to the transactions dataset to facilitate easier visualization during the EDA phase. This addition allows us to analyze and identify trends in the patient visits by day of the week, which will help us to determine later which days are most popular.
To create this column, DAYNAME function was applied to the Appointment Date field, extracting the specific day of the week for each transaction. This could potentially uncover patterns in appointment scheduling and may allow us to optimize resource allocation accordingly.Two new columns, Appointment Date and Appointment Time, were created to separate the date and time components of each appointment. This separation allows for more granular and effective analysis during the EDA phase, enabling us to better understand patterns in appointment scheduling.
-- Test: Check if Date and Time are converted correctly to the respective columns
SELECT
	`Appointment Date Time`,
    STR_TO_DATE(`Appointment Date Time`,'%m/%d/%y') AS Appointment_Date,
    TIME(STR_TO_DATE(`Appointment Date Time`,'%m/%d/%y%h:%i%p')) AS Appointment_Time
FROM transactions;

-- Test: Check if Date and Time are converted correctly to the respective columns and if there are any null values after conversion
SELECT
	`Appointment Date Time`,
    STR_TO_DATE(`Appointment Date Time`,'%m/%d/%y') AS Appointment_Date,
    TIME(STR_TO_DATE(`Appointment Date Time`,'%m/%d/%y%h:%i%p')) AS Appointment_Time
FROM transactions
WHERE STR_TO_DATE(`Appointment Date Time`,'%m/%d/%y') IS NULL
AND TIME(STR_TO_DATE(`Appointment Date Time`,'%m/%d/%y%h:%i%p')) IS NULL;

-- Add two new columns in transactions dataset - Appointment Date and Appointment Time column
ALTER TABLE transactions
ADD COLUMN `Appointment Date` DATE,
ADD COLUMN `Appointment Time` TIME;

-- Insert values and Update the two new columns in transactions dataset
UPDATE transactions
SET
	`Appointment Date` = STR_TO_DATE(`Appointment Date Time`,'%m/%d/%y'),
    `Appointment Time` = TIME(STR_TO_DATE(`Appointment Date Time`,'%m/%d/%y%h:%i%p'));
Adding Day of the Week to the transactions Dataset
A Day column was introduced to the transactions dataset to facilitate easier visualization during the EDA phase. This addition allows us to analyze and identify trends in the patient visits by day of the week, which will help us to determine later which days are most popular.
To create this column, DAYNAME function was applied to the Appointment Date field, extracting the specific day of the week for each transaction. This could potentially uncover patterns in appointment scheduling and may allow us to optimize resource allocation accordingly.
-- Test: Indicate the day based on the Appointment Date to analyze the popularity in the days with the customer.
SELECT
	`Appointment Date`,
    DAYNAME(`Appointment Date`) AS `Day`
FROM transactions;

-- Modify transactions dataset and add a new column called `Day`
ALTER TABLE transactions
ADD COLUMN `Day` TEXT;

-- Insert values into the new column and update the dataset
UPDATE transactions
SET `DAY` = DAYNAME(`Appointment Date`); 
Exploratory Data Analysis (EDA)
Before diving into EDA, a set of guiding questions were prepared during the phase of understanding our data and they have been categorized into four key areas to help uncover valuable insights:
Data Quality
Are there any patients that are in the transactions dataset but not in the patients dataset and vice versa?
Are there any missing values, and how they should be handled?
Patient Demographics
What is the age and gender distribution of our patients?
Are most of our patients new or are they existing patients?
Are there any correlation between patient’s age and clinic visits?
Clinic Operations and Appointment Trends
Which doctors have the highest number of consultations, and does this vary by clinic location?
Are there peak period for the appointments?
How does the appointment length vary by appointment type?
What is the distribution of visit statues (e.g, completed, canceled, no-show) and if there are certain appointment types more prone to cancellations or no-shows?
Financial and Operational Insights
What is the most common payment modes used by patients?
What is the average consultation price across different doctors or clinics?
Which region have the highest volume of sales?
Findings and insights on the respective category are found below.
Data Quality
During the data understanding phase, discrepancy of two records between the patients and transactions datasets were identified. To further investigate, left join was utilized to determine if there were any patients present in one dataset but missing from the other.
The first query aims to find out if there are any patients in the patients dataset but not in the transactions dataset. The results showed that aside from the 135 records without a Patient ID, all patients in the patients dataset were present in the transactions dataset.
-- Patients in patients dataset but not in transactions dataset
SELECT p.`Patient ID`
FROM patients p
LEFT JOIN transactions t ON p.`Patient ID` = t.`Patient ID`
WHERE t.`Patient ID` IS NULL;


Similar SQL query was applied to the transactions dataset, revealing two Patient IDs - 11042 and 17060, that were present in the transactions dataset does not exist in the patients dataset.
-- Patients in transactions dataset but not in patients dataset
SELECT t.`Patient ID`
FROM transactions t
LEFT JOIN patients p ON t.`Patient ID` = p.`Patient ID`
WHERE p.`Patient ID` IS NULL;

This suggest that out of the 135 records with missing Patient ID, two may have been omitted from the patients dataset. To resolve this, cross-check with other datasets is required to accurately link them to the correct patients. However, such dataset is not provided in this case study. Additionally, the remaining 133 patients without a Patient ID likely have not yet made any transactions.
Patient Demographics
Patients Demographics in Age and Gender

This analysis explores the age and gender distribution within our patient dataset for podiatry services. The graph shows that majority of the patients are between 31 and 55 years old, and overall, consist of more females.
Insights:
Age Distribution
The concentration of patients within 31 and 55 years old suggests that this demographic is actively engaged with podiatry services. This may indicate an increased awareness or the need for foot care within this age group, potentially due to lifestyle factors, occupational reasons, or general foot health issues.
Gender Distribution
The higher proportion of female patients could reflect foot-related issues being more common among women. This may suggest that women are more likely to seek podiatric care.
Suggestions:
Tailored Services: With a higher number of female patients, services and treatments can be designed to address issues that are more prevalent among women.
Marketing and Outreach: This demographic information can be used to tailor marketing strategies, ensuring the outreach and promotional efforts are directed towards this age group.
# 10 years Age Bin Calculated Field
IF FLOOR(DATEDIFF('year',[Birthday],Today())) >= 28 AND FLOOR(DATEDIFF('year',[Birthday],Today())) <= 30 THEN '28-30'
ELSEIF FLOOR(DATEDIFF('year',[Birthday],Today())) >= 31 AND FLOOR(DATEDIFF('year',[Birthday],Today())) <= 40 THEN '31-40'
ELSEIF FLOOR(DATEDIFF('year',[Birthday],Today())) >= 41 AND FLOOR(DATEDIFF('year',[Birthday],Today())) <= 50 THEN '41-50'
ELSEIF FLOOR(DATEDIFF('year',[Birthday],Today())) >= 51 AND FLOOR(DATEDIFF('year',[Birthday],Today())) <= 60 THEN '51-55'
ELSEIF FLOOR(DATEDIFF('year',[Birthday],Today())) >= 61 AND FLOOR(DATEDIFF('year',[Birthday],Today())) <= 70 THEN '61-70'
ELSEIF FLOOR(DATEDIFF('year',[Birthday],Today())) >= 71 AND FLOOR(DATEDIFF('year',[Birthday],Today())) <= 80 THEN '71-80'
ELSEIF FLOOR(DATEDIFF('year',[Birthday],Today())) >= 81 AND FLOOR(DATEDIFF('year',[Birthday],Today())) <= 90 THEN '81-90'
ELSE 'Others'
END
Demographics Trends in Appointment Type


The analysis shows that 68.15% of the patients are returning for a follow-up visits, while the 28.02% are new patients. This suggest that the patient base largely consist of individuals undergoing ongoing treatments or requiring regular monitoring. Additionally, only a small percentage of patients, 3.83%, are coming in for procedures, indicating that the clinic’s services are predominantly focused on focused care and follow-ups, rather than one-time intervention.
Insights:
Returning Patients
The high percentage of returning patients may suggest satisfaction with the services provided and also indicates the effectiveness of ongoing treatment plans that requires follow-up visits to monitor the progress. Given that podiatry deals with foot conditions that requires continuous management, more follow-up visits aligns with the nature of the services required and the treatments keeps patients engaged over time.
New Patients
A relatively small number of new patients suggest a more stable and mature base of patients. However, this also indicates potential areas for growth to attract new patients, possibly through increased outreach, marketing efforts, or referral programs. Retaining the existing patients and attracting new patients is vital for the clinic’s long-term growth. We can potentially increase new patients via strategies, such as community outreach or partnership with other healthcare or insurance providers.
Procedures:
The minority visits for procedures suggests that either the clinic offers a limited number of procedural services or that the most patients’ needs are being met through non-invasive treatments and follow-ups. It might be important to better understand why procedural visits are low to decide if there is a need to expand procedural offerings or continue focusing on non-invasive treatments.
Suggestions:
Market Focus: Marketing efforts could be tailored to highlight the clinic’s strengths in ongoing patient care, while also promoting the procedural services available to attract patients who requires more specialized treatments. This may help to attract new patients to grow new patients base.
Enhance Follow-Up Process: With the high volume in follow-up visits, existing patient experience can also be enhanced with improved follow-up processes, with more personalized care plans for routine check-ins.
Correlation between Patient's Age and Clinic Visits

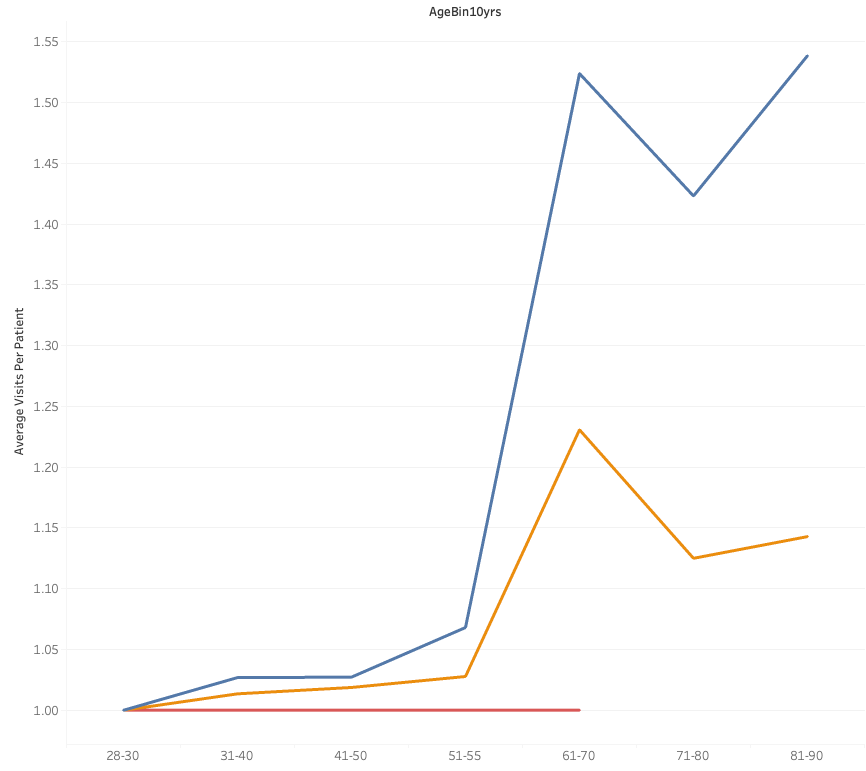

The graph above indicates a clear trend: as patients age, their average number of clinic visits increases. Specifically, those within the age range of 61 to 90 show a higher probability of returning to the clinic more frequently. This pattern suggests that the older patients may have more complex or ongoing healthcare needs, leading to more regular follow-up appointments.
Insights:
Increased Healthcare Needs with Age
The higher frequency of visits among older patients suggests that this demographic has more complex conditions that require ongoing care and monitoring.
Potential for Targeted Services
The clinic might be serving a population that requires specialized services tailored to the needs of older adults. The increased visit frequency among older patients could indicate the need for more resources, such as specialized staff or equipment, to effectively manage this demographic’s healthcare needs.
Suggestions:
Enhance Preventive Care: Implement more robust preventive care measures for this age group could help reduce the need for frequent visits. This might include regular screenings, health education, and proactive management of conditions. This could also potentially have a wider outreach as patients will likely recommend to people they meet who requires similar care.
Education and Support: Offer educational resources and support for self-care could empower older patients to manage their health effectively at home, potentially also reducing the necessary follow-up visits.
Clinic Operations and Appointment Trends
Uniform Appointment Durations across Clinics

The result above performed by SQL reveals that the duration of different appointment types is remarkably consistent across all clinics. New Patient appointments typically last 30 minutes, while Follow-Up Visits generally take between 15 to 30 minutes, which may be dependent on the type of treatment, and Procedures are scheduled for 60 minutes, reflecting the more intensive nature of these appointments.
This uniformity in appointment lengths suggests that the clinics have established a standardized approach to scheduling, ensuring each type of appointment is allocated an appropriate amount of time. Such consistency aids in the efficient management of clinic operations, as it allows easier staggering of appointments, reducing wait times and optimizing the use of clinic resources.
Insights:
The standardization of appointment durations across clinics indicates a well-structured system that promotes operational efficiency and consistency in patient care.
By ensuring each appointment type has a predefined length, clinics can better manage patient flow, minimizing overlaps and maximizing the use of available time slots.
This approach also help to enhances patient experience, as predictable appointment durations can lead to more accurate scheduling and reduced waiting times.
-- Appointment Length for Respective Appointment Type
SELECT
	DISTINCT(`Appointment Type`),
    `Appointment Length`
FROM transactions;
Patient Visit Trends: Peak Visit Days and Appointment Time


In the provided data subset, which only includes visits from Monday to Friday, an interesting trend was sighted. Mondays stand out as the most popular day for clinic visits, while Wednesdays appear to be the least favored. This could be influenced by specific dates like 03/01/2022 and 10/01/2022, both Mondays, which recorded the highest number of visits at 101 each. Conversely, Wednesdays, 12/01/2022 and 26/01/2022, has the lowest turnout with only 66 visits each.

Additionally, the analysis shows that 1pm is the peak time for appointments, suggesting a preference among patients for midday slots. In contrast, 12pm is the least favored time. These patterned could inform the clinic’s scheduling strategies, potentially optimizing staff availability and resource allocation during peak times and lessen the load during slower periods. The preference could also guide targeted communication or promotional efforts on less busy days to balance the clinic’s patient flow.
Correlation between Consultations Volume and Sales


When analyzing consultation volumes across clinics in the different regions, the data indicates that the East region slightly outperforms the others in terms of the number of consultations. The remaining regions, including South, West, North, and North East, show relatively similar consultation volumes.
The higher consultation volume in the East region translates directly into a higher sales volume. Suggesting a strong correlation between the number of consultations and overall revenue. Clinics that see more patients naturally generate more income.

The pricing structure is consistent across all regions, with minimal variation between different appointment types. New Patient appointments are priced at $80, Follow-Up Visits at $70 and Procedures at $100. This uniform pricing suggests that the clinics aim for standardization in service charges.
# Distinct Price Across appointment type
SELECT
	DISTINCT(`Appointment Type`),
    Price
FROM transactions;
Insights:
The East region has slightly higher consultation and sales volume could indicate greater demand for podiatry services in the area, possibly driven by a larger population within the area.
The consistent pricing across regions suggest a strategic decision to maintain uniform service charges, ensuring equality and prevent any price disparities across regions.
The correlation between consultation volume and sales underscores the importance of patient retention and follow-up care, as these contribute significantly to the clinic’s revenue stream.
Correlation between Clinic Location and Doctor

The dataset includes five doctors who serve across the other regions in Singapore. An interesting trend emerges from the heat map - although these doctors have the flexibility to work at any clinic, each one tends to focus their practice within a specific region. This could likely be driven by factors such as patient demand, logistical convenience, or doctor-patient relationships forged. Understand this can help to optimize clinic operations and resources allocated efficiently.
Financial and Operational Insights
Payment Mode Preference among Patients

The bar graph illustrates the payment preferences of patients across the clinics. The majority of patients prefer to pay via Credit Card, which could suggest that this payment method is more convenient or accessible for most patients and that patients are more likely to use Credit Card for recurring medical expenses, possibly due to the ability to defer payments or accumulate rewards.
Insurance payments rank as the second most common method, suggesting that patients with insurance coverage for podiatry services are likely to use it for their visits. This indicates a preference among insured patients to leverage their insurance benefits for podiatry care.
Cash payments are the least popular among patients. This may suggest that patients find non-cash methods more practical. The preference for electronic payments over cash could also reflect trends towards cashless transactions.
Understanding these payment trends allow clinic to optimize its payment processing systems or strengthening partnerships with insurance providers to attract more patients to ensure a seamless payment experience.
Patterns in Appointment Cancellations and No-Shows

Overall, most patients complete their appointments as scheduled. A notable trend is observed that a significant number of follow-up appointments are either missed or rescheduled. This may suggest that some patients may perceive the ongoing treatment not as important or they may experience changes in their condition that lead them to consider the necessity of follow-up visits.
Understanding this insight may suggest for the clinic to explore patient engagement strategies and assess the reasons behind rescheduling or missed appointments, potentially improving adherence to follow-up care.
Dashboard
Dashboard Design
Before actualizing our dashboard, it is important to identify the matrices that are important to our dashboard, while keeping the stakeholders priorities in mind.
As a subset of the data was given, dashboard matrices are only based on the information we have on hand.

Performance Dashboard

The aim of this dashboard is to empower relevant stakeholders to implement targeted strategies to enhance the overall performance of the clinic.